
Utilize the power of Lido to create a Multiple Project Dashboard in seconds. Enter your details in the box below to get started!


Easily manage several projects at once: instead of opening several spreadsheets and dashboards at once, you can simply use a single one displaying all the relevant data about the projects you handle at once.
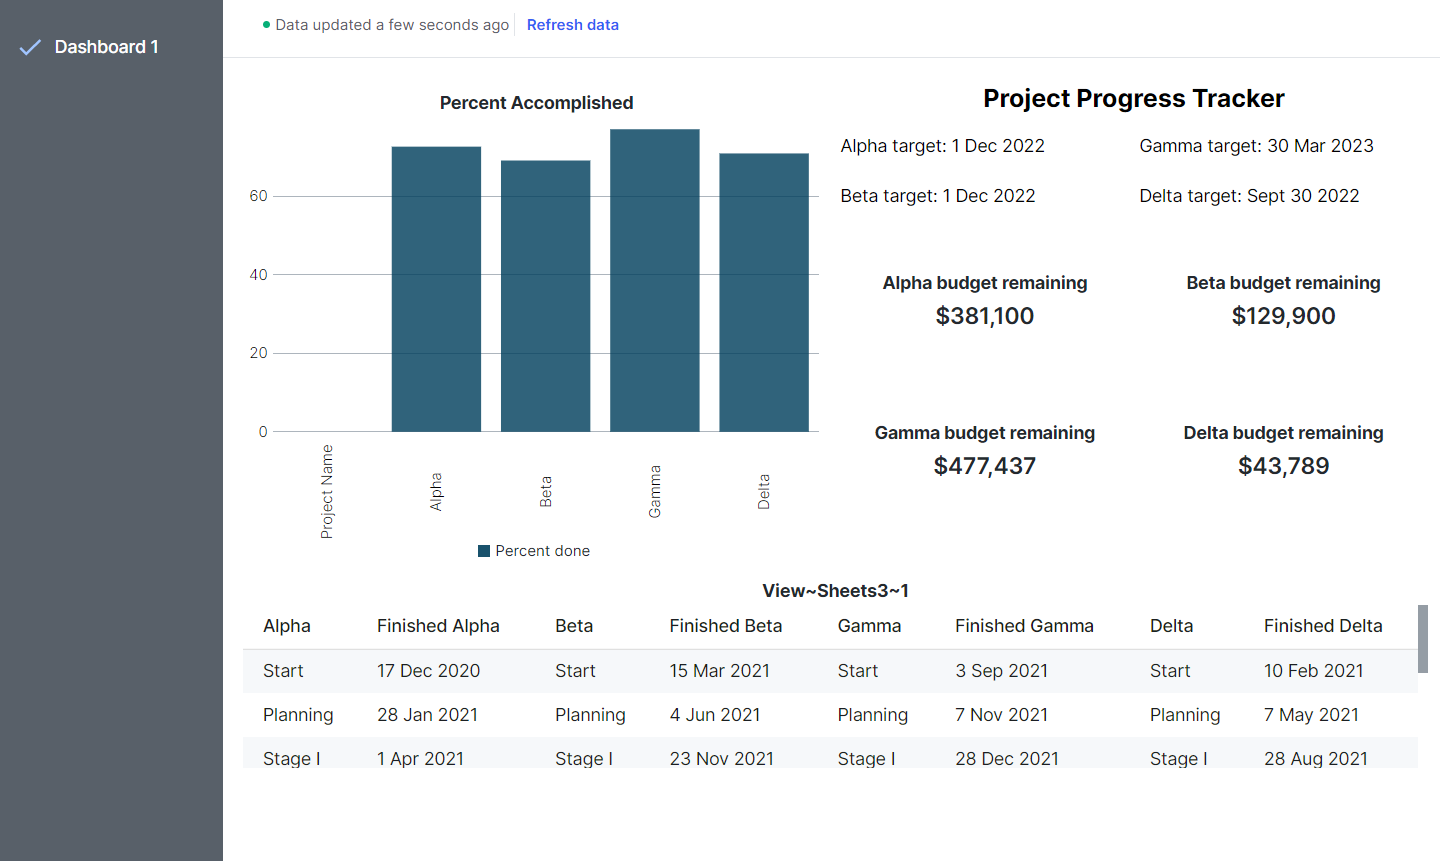
Keep track of metrics across different projects: different projects will utilize different sets of KPIs to quantify their progress. A single dashboard can display them together, making it easy for you to check their progress.
Compare the progress of several projects: different projects may utilize similar KPIs, which allows you to compare them. This is particularly useful for companies with multiple clients for example
Enhances collaboration across teams: different teams working on different projects can use it to determine whether they are maximizing their ROI for the effort they make, thus serving as a starting point for collaboration.
Realign resources whenever needed: some projects may be nearing completion earlier than expected, which means more resources may be free to be invested in other critical projects that will need them more.
KPIs vary widely depending on your industry and project type. With a dashboard it’s easy to set up your own unique KPIs and easily track them. Below are some example KPIs.
Budget and resource information: budget allocation, budget used and remaining budget, equipment resources
Manpower: people assigned for the tasks and their performance
Project progress: tasks accomplished and tasks yet to be completed, deliverables and output
Risk management: expected and unexpected costs, potential and recorded hazards
Schedule information: timeline for major and minor tasks, tracking whether the project is on time or lagging
After creating an account in Lido, you need to do two steps to create a dashboard:
Lido specializes in making it easy to import data from multiple platforms such as Firebase, Google Analytics, Salesforce, and MySQL and more. Don't see an integration you want? Contact us and we will add it. This makes it easy to pull in all of your data for your projects in just a few clicks and manage it in a centralized location.
Click Data on the upper-left corner of Lido to select the source.

Follow the instructions on entering access info and selecting the data columns to import in the Dataset Editor. Once you have finished selecting your data, click Save dataset & edit view in the top right corner. The data is now loaded to your Lido spreadsheet.

Set up the KPI formulas for each project. Lido functions are similar to that of Google Sheets, so you can apply to Lido what you have learned in our tutorials.

After loading the data, click the Dashboard on the top of the Lido spreadsheet, then click the Components tab on the right side. Drag-and-drop components and add data to them.

Once you have finished constructing your report, click Preview on the upper-right corner to see how it will look once deployed.
Click Share to share your dashboard with your team or clients.