
Discover how ecom businesses just like yours are using Lido to increase sales with our E Commerce KPI Dashboard. Click the link below to try it for FREE!


The following are some of the most popular metrics e-commerce companies include in their dashboards.
Total Sales: This KPI is the total amount of revenue your store has generated.
Average Order Value (AOV): AOV is the average amount each ecommerce customer spends per order. You can calculate it by dividing total sales by the number of orders. Increasing this KPI means you can increase revenue with the same number of sales.
Conversion Rate (CR): Conversion rate is the percentage number of e-commerce visitors who purchase. The higher the conversion rate, the more sales you will have with the same amount of traffic. This is one of the most important KPIs to track in ecommerce.
Net Profit: Net profit is the profit (or loss) that exists after deducting operating expenses, interest, and taxes from your total sales.This is the ultimately the most important KPI for an established ecommerce store and should be on every dashboard.
Return on Ad Spend (ROAS): ROAS is the amount of money you make from your ad spend. This is usually tracked as a multiple. If your ad spend is $1,000 and your sales are $3,000 then you have a ROAS of 3. This is a very popular KPI in ecommerce and should be included in any dashboard.
Cost Per Acquisition (CPA): This KPI tracks how much it costs you to acquire a customer. It is calculated by taking total AD spend and dividing it by the number of new customers.
Items Sold: This is the number of units sold across all Stock Keeping Units (SKUs).
Refund Rate: This is the percentage number of customers that request a refund and is a good KPI to track how happy your ecommerce customers are and how good your product offering is.
Lifetime Value (LTV): This KPI tracks how much the average customer will spend over their entire relationship with your ecommerce store
Average Order Frequency (AOF): Average order frequency is how often on average an existing customer places an additional order. By increasing this KPI you can increase revenue with the same number of customers in your ecommerce funnel.
In just seven simple steps, you can bring the data from your ecommerce store, targeted ad campaigns, email marketing campaigns, and SMS marketing into your dashboard and track leading KPIs.
Step 1: Log into your Lido App account and choose the integrations page.
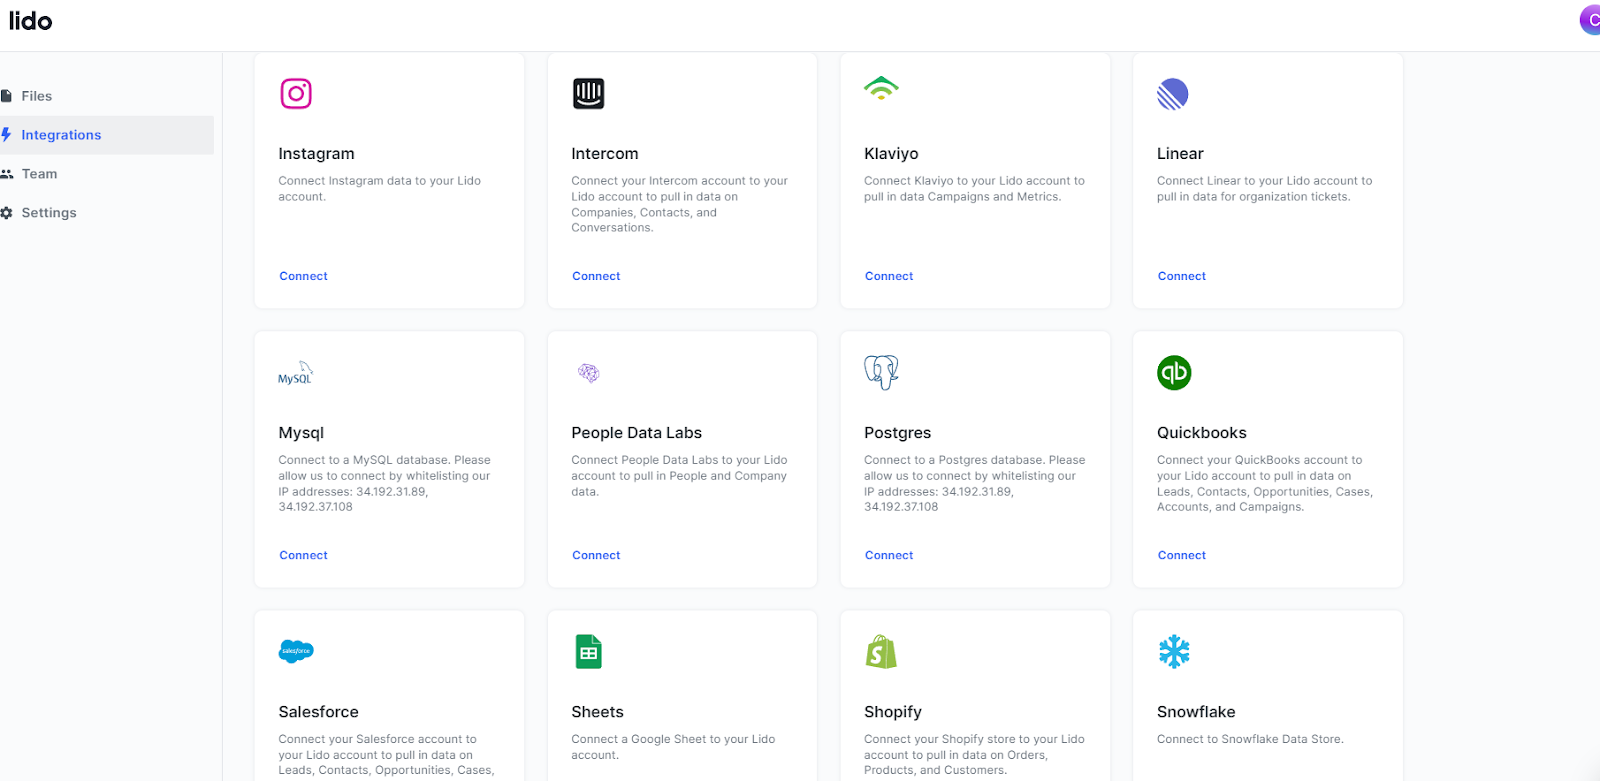
Step 2: Choose Shopify and enter your store’s URL.

Step 3: Install the Lido app on the Shopify page.

Now you have your first active integration.

Step 4: Choose to connect to Facebook from the integrations page.
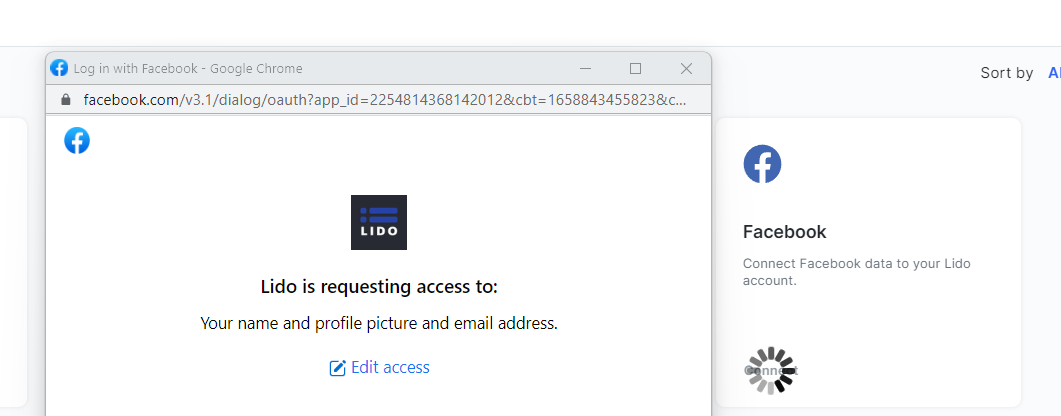
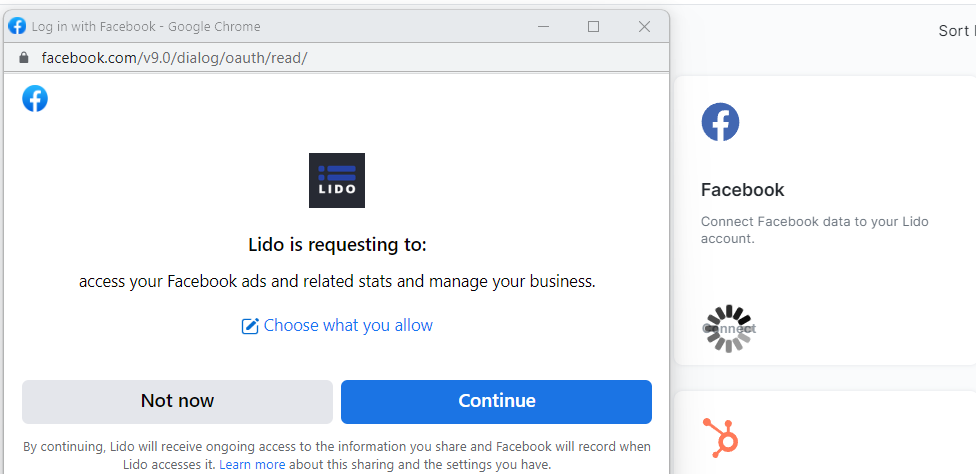
Step 5: Choose to allow Lido to access Facebook Ads and related stats.
Step 6: Log in to your Klaviyo account. Choose your account in the upper right corner. Then choose settings followed by “API Keys.” Next, click the “Create Private API Key” button on the right-hand side. Copy the newly created private API key.

Step 7: Paste the API Key into the “Connect to Klaviyo” box and click connect.

Now you have three active integrations to use in your Lido App’s dashboard.

In just 7 steps, you have brought the data into your dashboard from your
These are just a small sample of the many data connections you can bring into your dashboard to track your most important KPIs